
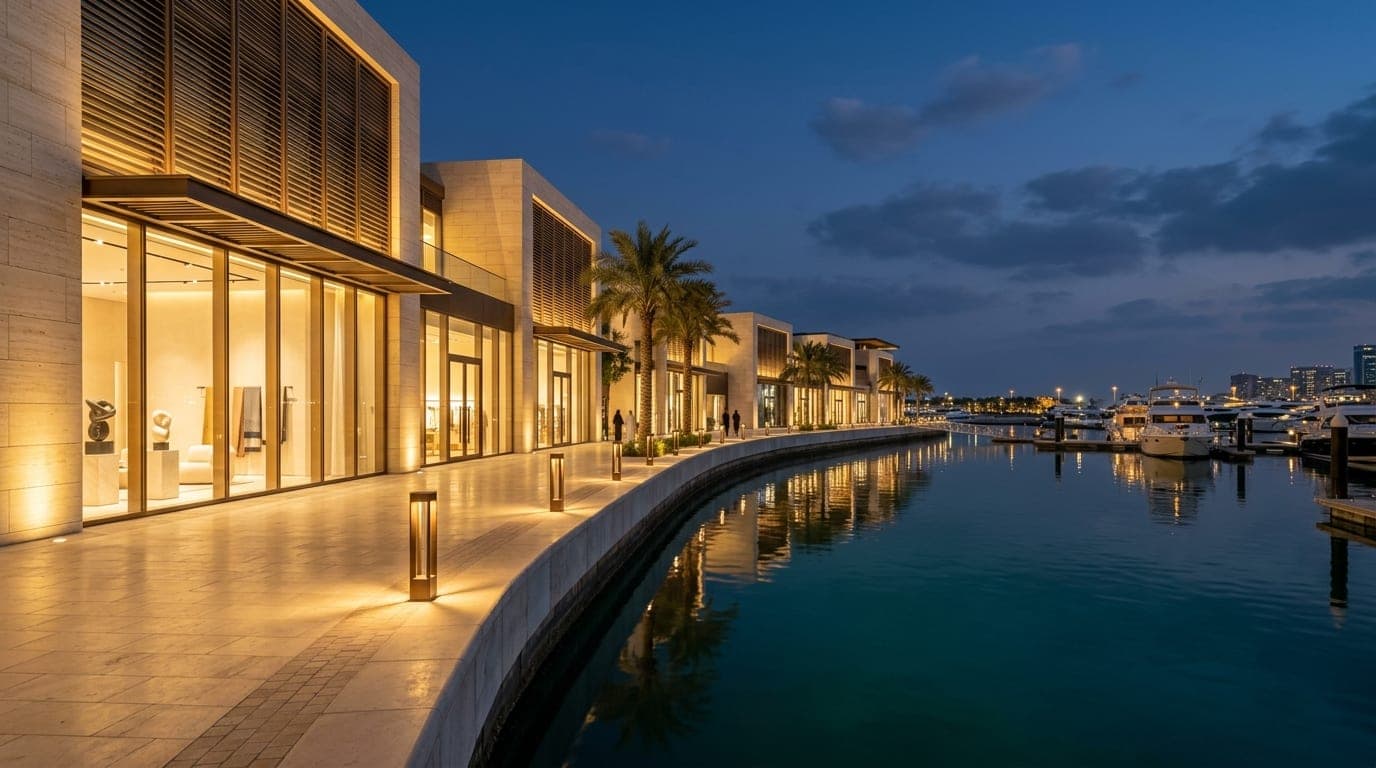
Retail Galleria · Abu Dhabi
|Luxury Trophy Retail · Freehold — Waterfront Investment ZoneSolace Waterfront Retail Galleria
An ultra-prime marina promenade of 32 luxury retail & fine-dining pavilions with 93.8% occupancy and turnover rent upside.
Waterfront Marina Corridor · Abu Dhabi
Asking Valuation / Cost
AED 118M
AED 1,356 / sq ft
Net Initial Yield (Cap Rate)
7.5%
NOI: AED 8.9M
Projected 5-Yr IRR / ROI
15.2%
+4% / yr escalation
Units Rented / Total
30 / 32
2 vacant (Upside)
Occupancy Rate
93.8%
AED 151 / sq ft
Built-Up Area (BUA)
87,000 sq ft
WALT: 5.3 yrs
01 / Executive Summary
Institutional fundamentals, considered in full.
Solace Waterfront Retail Galleria is a trophy lifestyle destination spanning 87,000 sq ft of gross built-up area (78,000 sq ft GLA) along a 280-metre private marina promenade in Abu Dhabi. Clad in hand-selected Roman travertine and architectural bronze louvers, the destination comprises 32 bespoke units anchored by Michelin-pedigree dining concepts, haute horlogerie boutiques and private wellness clubs.
Currently 30 of the 32 units are leased on base-rent plus turnover-percentage structures, generating AED 11.77M in gross annual income and AED 8.85M in Net Operating Income (7.5% net initial yield).
Key Investment & Covenant Highlights
- 30 of 32 retail & dining units rented (93.8% occupancy)
- 280-metre direct marina frontage with yacht berthing access
- Base rent + 8%–12% turnover rent clauses on all F&B anchors
- 5.3-year Weighted Average Lease Term (WALT)
- 260 valet & subterranean climate-controlled parking bays
- 100% service-charge recovery from tenants
Confidentiality by Design — Exact Plot & Title Deed Reserved
CONFIDENTIALITY & DISCLAIMER: This Executive Investment Profile is issued by LIMITLESS BUSINESS FOR PROPERTY LEASING AND MANAGEMENT L.L.C. (Abu Dhabi, UAE) strictly for preliminary evaluation by sophisticated investors. All figures are indicative. Exact plot coordinates, title deeds and tenant lease contracts are released upon execution of a Non-Disclosure Agreement.
Acquire or Enquire on This Mandate
Download the complete Investment Profile PDF or request the audited data room and VIP site inspection with our Relationship Director.
Includes ROI, NOI, 30/32 rented units schedule, rent/sq ft & 5-year cash-flow table.
Figures shown are indicative underwriting metrics for preliminary evaluation and do not constitute a binding offer or regulated financial advice.
02 / Financial & Underwriting Matrix
Capital, Income & Return Profile.
03 / Tenancy & Stacking Schedule
Floor-by-Floor Rent Roll & Units.
Breakdown of leasable suites, rented vs. vacant units, passing rent per sq ft and annualised income across building zones.
| Floor / Zone | Permitted Use / Configuration | Rented / Total Units | GLA (Sq Ft) | Rent / Sq Ft (AED) | Annual Rent (AED) | WALT |
|---|---|---|---|---|---|---|
| Promenade Pavilions A – D | Fine Dining & Waterfront Terraces | 8 / 8100% | 32,000 | AED 195 | AED 6,240,000 | 6.2 yrs |
| Galleria Boutiques E – L | Haute Horlogerie, Jewelry & Concept Retail | 17 / 1894% (1 vacant) | 31,000 | AED 140 | AED 4,095,000 | 4.5 yrs |
| Upper Deck Suites | Wellness Clubs & Private Medical Concierge | 5 / 683% (1 vacant) | 15,000 | AED 115 | AED 1,437,500 | 5.0 yrs |
| Portfolio Total / Weighted | Luxury Trophy Retail · Freehold — Waterfront Investment Zone | 30 / 32 (93.8%) | 78,000 | AED 151 | AED 11,772,500 | 5.3 yrs |
Tenant Covenant & Sector Allocation
04 / Interactive Return Simulator
Model Your Capital & Cash-Flow Horizon.
Adjust financing leverage (LTV), holding period and annual rental escalation to stress-test projected cash flow and equity returns.
05 / Architectural Gallery
06 / Interactive 3D Massing
Spatial geometry from every elevation.
Drag to orbit, scroll to zoom and toggle between Gulf daylight and twilight illumination. The 3D model illustrates architectural massing and scale while preserving site confidentiality.
Illustrative 3D Massing · Location Withheld by Design
Comparable Mandates
Selected Alternatives
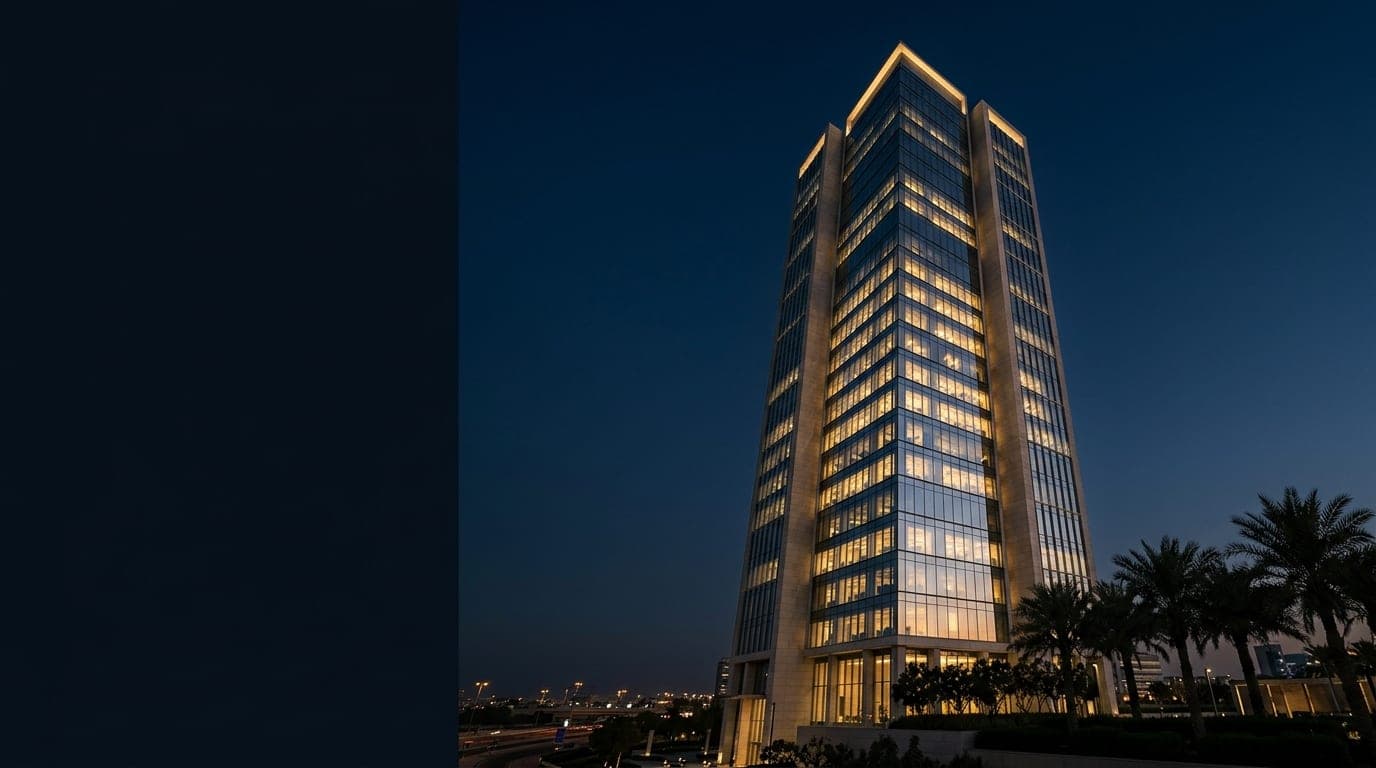
Commercial Office · Abu Dhabi · Central Business District · Al Maryah Corridor
The Arc Commercial Tower
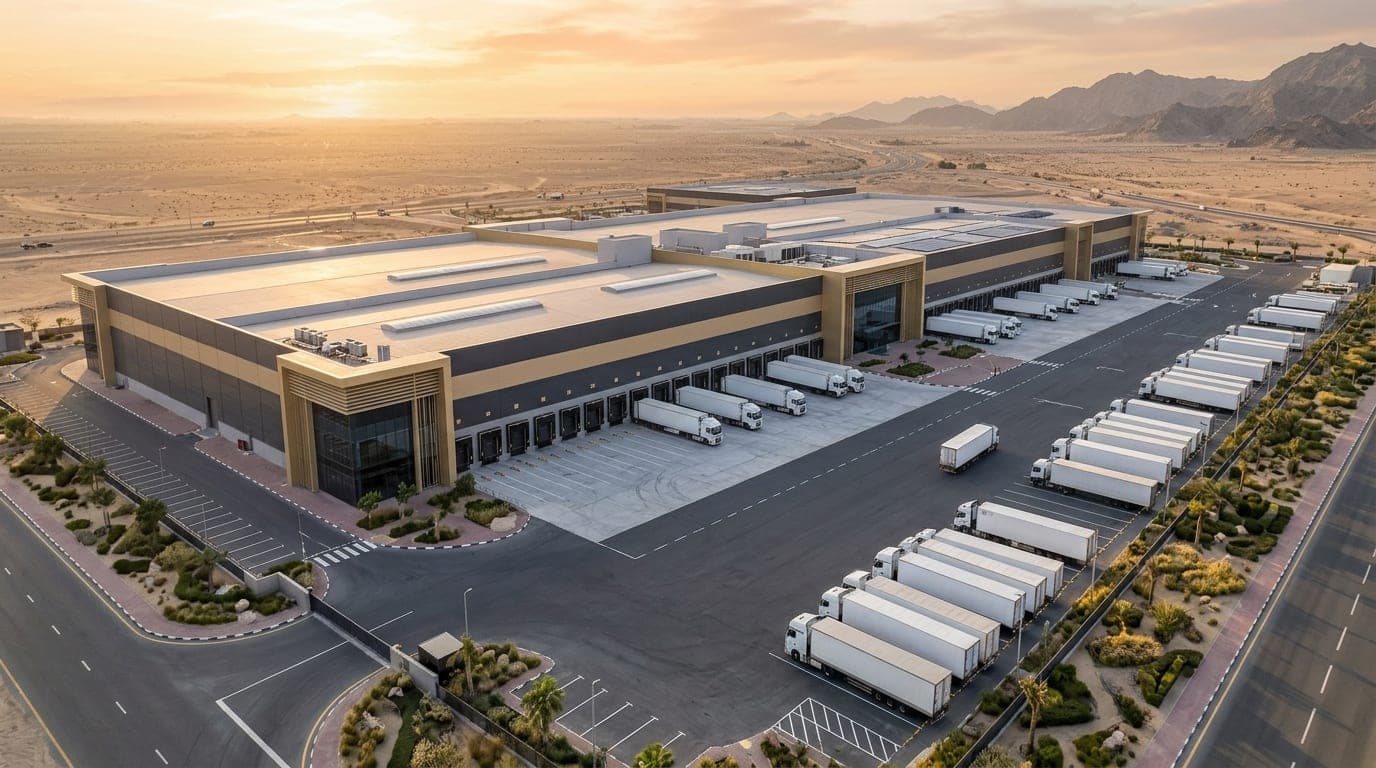
Industrial & Logistics · Dubai · Southern Logistics & Aviation Corridor
Meridian Institutional Logistics Estate
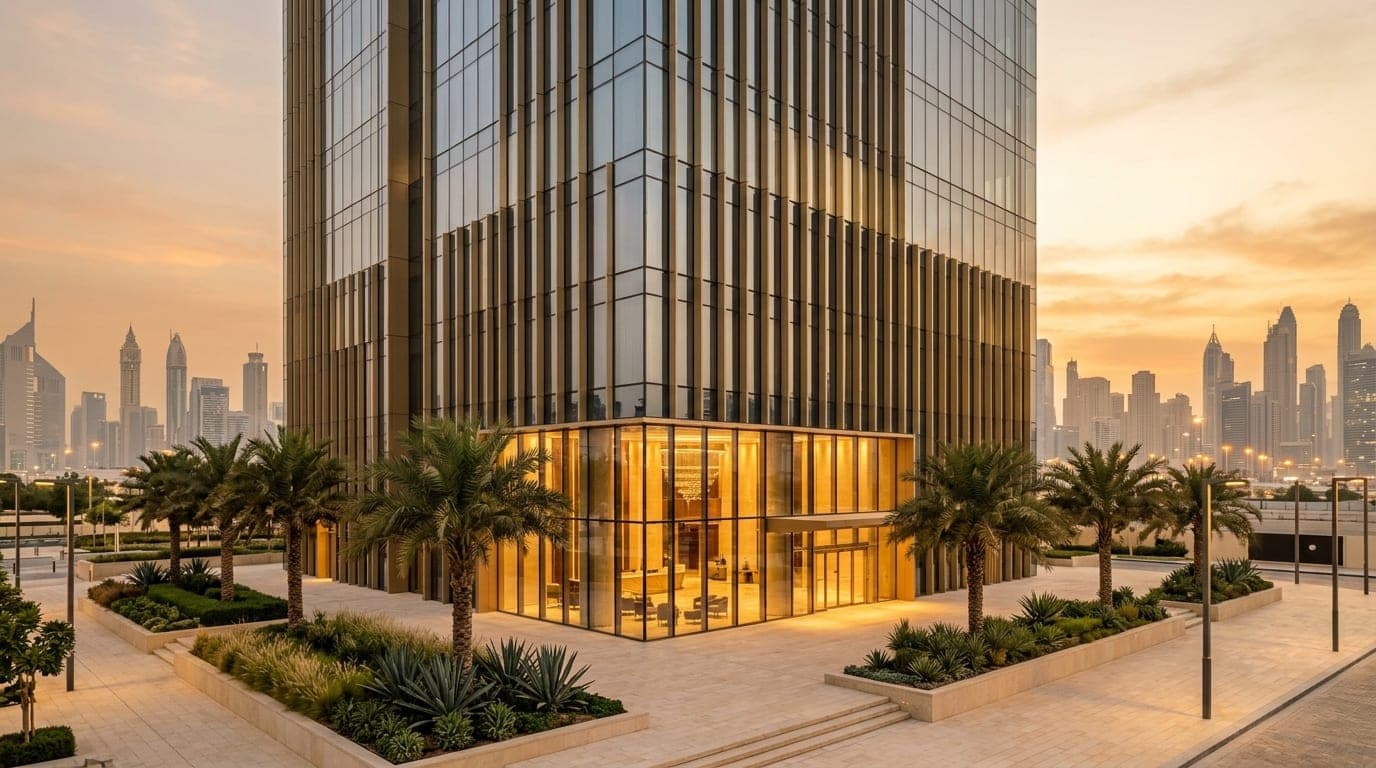
Commercial Office · Dubai · Business Bay · Canal Front